
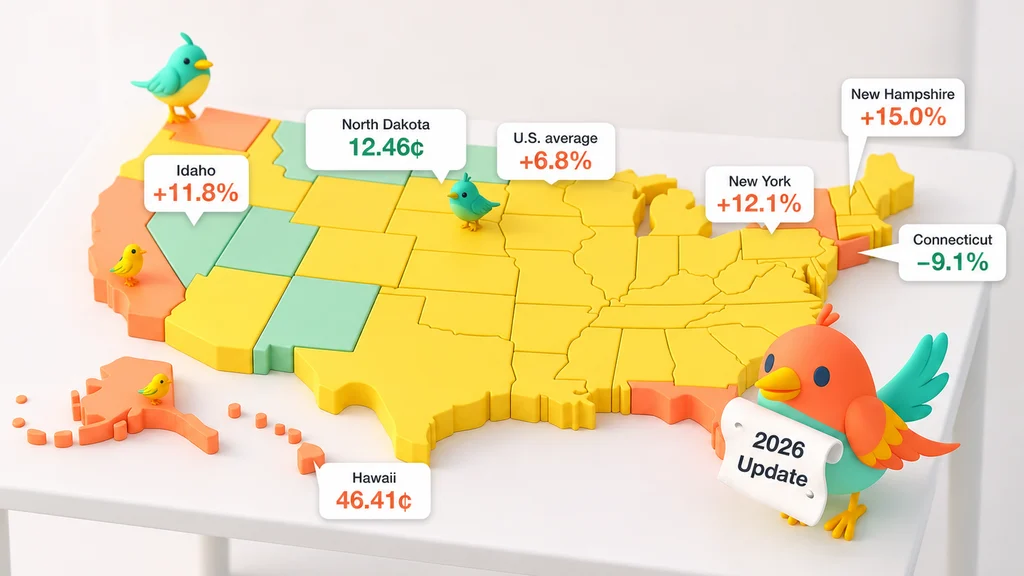
Electricity prices are climbing across America, but not everyone is feeling the increase equally. While some states are experiencing double-digit price hikes, a few states have seen relief. And surprisingly, even neighboring states are moving in opposite directions.
Our analysis of the latest U.S. Energy Information Administration (EIA) data reveals some unexpected shifts in residential electricity costs across all 50 states. Here's what the numbers tell us about 2026.
The Average Home Is on Track to Pay $125 More for Electricity
The average residential electricity price in the United States reached 18.19 cents per kilowatt-hour (kWh) during January–August 2026, compared with 17.03 cents during the same period in 2025.
That's a 6.8% increase in just one year.
For a household using 900 kWh per month, this difference translates to approximately $125 in additional electricity costs annually, assuming the same usage and price difference throughout the year.
But the national average hides a much more interesting story. Electricity prices aren't moving uniformly across the country.
Idaho Was One of America's Cheapest Power States. Its Prices Just Jumped 12%.
States known for relatively inexpensive electricity are not immune to rising costs.
Idaho, historically one of the most affordable states, saw residential electricity prices rise 11.8%, from 11.65 to 13.02 cents per kWh.
Washington experienced a similar 11.7% increase, with rates climbing from 12.91 to 14.42 cents.
Other states recorded even larger increases:
- New Hampshire: +15.0%
- Ohio: +13.0%
- Virginia: +13.0%
- Maryland: +12.6%
- New York: +12.1%
Washington, DC, recorded a particularly sharp increase of 17.2%.
Although Idaho and Washington remain relatively affordable compared with places like California and Hawaii, their recent increases challenge the assumption that historically low-cost electricity markets will necessarily remain stable.
Notable electricity price increases in 2026
January–August 2026 versus the same period in 2025
Connecticut and Maine Just Swapped Electricity Prices
Perhaps the most surprising finding comes from New England, where neighboring states are experiencing dramatically different price movements.
| State | 2025 | 2026 | Change |
|---|---|---|---|
| Connecticut | 30.21¢ | 27.47¢ | -9.1% |
| Massachusetts | 30.21¢ | 30.19¢ | -0.1% |
| Maine | 27.47¢ | 30.23¢ | +10.0% |
| New Hampshire | 23.40¢ | 26.91¢ | +15.0% |
Average residential price per kWh, January–August of each year.
Connecticut residents are seeing meaningful relief, with average electricity prices falling more than 9%. Across the border, Massachusetts prices have remained almost unchanged.
Meanwhile, Maine and New Hampshire are experiencing substantial increases.
Neighboring states, very different price changes
New England residential price change, January–August 2026 versus 2025
How can neighboring states within the same regional energy market experience such different outcomes?
Electricity prices reflect more than the cost of generating power. Utility procurement arrangements, transmission and distribution expenses, regulatory decisions, and the timing of rate adjustments can all influence what consumers ultimately pay.
The contrast illustrates why regional averages alone cannot tell the complete story.
Same Electricity, $3,600 More a Year: The Hawaii Penalty
Hawaii continues to hold the distinction of having the nation's most expensive residential electricity.
Its average price reached 46.41 cents per kWh during the first eight months of 2026, an increase of 14.7% from the same period in 2025.
Compare that with North Dakota, where residents pay an average of just 12.46 cents per kWh.
That means electricity in Hawaii costs approximately 3.7 times as much per unit.
At identical consumption of 900 kWh per month, the difference amounts to roughly $306 per month, or more than $3,600 annually.
Actual household bills also depend on usage, which can vary substantially between states.
Hawaii's geographic isolation and reliance on imported fuels have historically contributed to its higher electricity costs. The latest increase demonstrates how significant that price disadvantage remains.
Why Your Summer Bill Is Up $11 a Month
A higher price per kilowatt-hour is only part of the story.
The amount of electricity a household consumes matters just as much.
According to the EIA's September 2026 outlook, the average monthly U.S. residential electricity bill for the summer was forecast to rise from $185 in 2025 to $196 in 2026.
That's approximately 5.9% more, reflecting increases in both projected electricity prices and consumption.
For homeowners and rental property operators, this distinction matters.
Air conditioning, heating, aging appliances, insulation, and equipment efficiency can all influence electricity consumption. Even modest increases in usage can compound the impact of higher rates.
Understanding energy expenses requires looking at both electricity prices and how efficiently a property uses power.
Your Rate Is Out of Your Control. Your Usage Isn't.
While individual households have limited influence over utility rates, they can take steps to better understand and manage electricity costs.
Start by monitoring monthly electricity consumption rather than focusing only on the total bill. A sudden increase in usage may indicate changes in occupancy, weather, appliance performance, or building efficiency.
Maintaining HVAC equipment, replacing clogged filters, checking insulation, and evaluating aging appliances can also help identify opportunities to reduce unnecessary consumption.
For owners managing multiple properties, comparing electricity usage and expenses across similar homes can reveal patterns that might otherwise go unnoticed.
The goal isn't simply to find cheaper electricity. It's to understand where energy is being consumed and whether that consumption is reasonable.
Three Patterns to Watch for the Rest of 2026
The first eight months of 2026 reveal three important trends.
First, electricity prices are continuing to rise nationally, adding pressure to household expenses.
Second, historically affordable states are experiencing meaningful increases of their own.
And third, the differences between neighboring states demonstrate that local electricity markets can move in very different directions.
Whether these patterns continue throughout the remainder of 2026 remains to be seen.
One thing is clear: where you live still matters enormously when it comes to electricity costs—but how quickly those costs are changing may matter just as much.
Electricity Prices in All 50 States and DC
Hawaii stands alone at 46.41 cents per kWh, and only three other states, California, Maine and Massachusetts, pay more than 30 cents. Seventeen states and DC are above the 18.19-cent national average. At the other end, North Dakota, Nebraska and Idaho pay the least, at about 13 cents or less.
| Hawaii | 46.41 | 40.46 | +14.7% |
|---|---|---|---|
| California | 32.58 | 31.11 | +4.7% |
| Maine | 30.23 | 27.47 | +10.0% |
| Massachusetts | 30.19 | 30.21 | −0.1% |
| New York | 29.26 | 26.10 | +12.1% |
| Rhode Island | 29.05 | 29.09 | −0.1% |
| Connecticut | 27.47 | 30.21 | −9.1% |
| Alaska | 27.32 | 26.07 | +4.8% |
| New Hampshire | 26.91 | 23.40 | +15.0% |
| District of Columbia | 24.86 | 21.22 | +17.2% |
| New Jersey | 24.09 | 22.32 | +7.9% |
| Vermont | 23.93 | 22.30 | +7.3% |
| Michigan | 21.73 | 19.94 | +9.0% |
| Maryland | 21.31 | 18.93 | +12.6% |
| Pennsylvania | 21.13 | 18.86 | +12.0% |
| Illinois | 19.23 | 17.44 | +10.3% |
| Wisconsin | 19.05 | 18.02 | +5.7% |
| Ohio | 18.81 | 16.64 | +13.0% |
| Delaware | 17.98 | 16.79 | +7.1% |
| Indiana | 17.04 | 15.69 | +8.6% |
| Virginia | 16.95 | 15.00 | +13.0% |
| Colorado | 16.80 | 15.47 | +8.6% |
| Alabama | 16.51 | 16.01 | +3.1% |
| Minnesota | 16.44 | 15.78 | +4.2% |
| Texas | 16.03 | 15.18 | +5.6% |
| South Carolina | 15.90 | 14.98 | +6.1% |
| West Virginia | 15.58 | 15.37 | +1.4% |
| Georgia | 15.48 | 14.86 | +4.2% |
| Oregon | 15.46 | 15.37 | +0.6% |
| Arizona | 15.36 | 15.18 | +1.2% |
| New Mexico | 15.34 | 14.68 | +4.5% |
| Florida | 15.32 | 15.04 | +1.9% |
| Kansas | 15.26 | 14.27 | +6.9% |
| Mississippi | 15.06 | 13.87 | +8.6% |
| North Carolina | 14.94 | 13.81 | +8.2% |
| South Dakota | 14.58 | 13.20 | +10.5% |
| Iowa | 14.55 | 13.72 | +6.0% |
| Washington | 14.42 | 12.91 | +11.7% |
| Missouri | 14.28 | 13.32 | +7.2% |
| Kentucky | 14.20 | 13.04 | +8.9% |
| Montana | 14.13 | 12.76 | +10.7% |
| Wyoming | 14.01 | 13.08 | +7.1% |
| Oklahoma | 13.81 | 12.95 | +6.6% |
| Tennessee | 13.80 | 13.24 | +4.2% |
| Arkansas | 13.74 | 12.74 | +7.8% |
| Nevada | 13.36 | 13.10 | +2.0% |
| Louisiana | 13.27 | 12.54 | +5.8% |
| Utah | 13.19 | 12.84 | +2.7% |
| Idaho | 13.02 | 11.65 | +11.8% |
| Nebraska | 12.92 | 11.94 | +8.2% |
| North Dakota | 12.46 | 11.67 | +6.8% |
| U.S. average | 18.19 | 17.03 | +6.8% |
About the Data
This analysis uses residential electricity price data from the U.S. Energy Information Administration (EIA), Electric Power Monthly, Table 5.6.B, released October 23, 2026.
All 2026 figures represent January–August year-to-date averages and are preliminary. Percentage changes compare January–August 2026 with the corresponding period in 2025, not with full-year averages.
Electricity prices represent average residential retail revenue per kilowatt-hour, rather than individual utility tariff rates. Household cost examples assume constant electricity consumption and are illustrative.
Source: U.S. Energy Information Administration — Residential Electricity Prices by State


